EDR Series Part 2: Testing the Runtime Assumption - Are Injection APIs The Trigger?
Overview
Part 1 tested the first detection assumption:
Do the injection imports themselves trigger Defender?
The answer was no. The binary was clearly identifiable as an injector from its import table, but the imports alone were insufficient to produce a Defender detection.
That result raises the next question.
If static analysis is not firing on the imports, what happens when those APIs are actually executed? Many practitioners assume that functions such as VirtualAllocEx, WriteProcessMemory, and CreateRemoteThread become the detection trigger at runtime.
This post tests that assumption by tracing the full API path from user code to the kernel and observing what happens when the injection chain executes on a live Microsoft Defender for Endpoint (MDE) protected system.
The larger question remains the same:
At which layer does detection actually fire?
Test scope: All observations in this post were collected from a fully onboarded Windows 11 endpoint running the Microsoft Defender for Endpoint sensor available at the time of testing. EDR implementations evolve over time, and different Windows builds, sensor versions, configurations, or third-party integrations may produce different results. The conclusions here should be interpreted as observations from the tested environment rather than universal characteristics of all MDE deployments.
What this post covers:
- The four-layer Windows API model: Win32 → kernelbase → NT API → syscall
- What forwarding thunks are and why kernel32 is mostly a compatibility layer
- How userland ntdll hooks work
- What MDE appears to hook in practice
- A live injection test against MDE
- Why telemetry collection and detection are not the same thing
The Runtime Hypothesis
If the import table was not sufficient to trigger Defender’s static engine, several explanations are possible:
- The runtime API calls themselves are the detection trigger.
- The API calls generate telemetry but are not detections by themselves.
- Detection occurs only when additional malicious behaviour follows.
The goal of this test is to determine which explanation best matches the observed behaviour.
The Layered API Model
Windows API calls do not go directly to the kernel.
A call such as:
1
VirtualAllocEx(...)
passes through multiple layers before the operating system performs the actual allocation.
flowchart TD
    A["<b>Your Code</b><br/>VirtualAllocEx(hProcess, ...)"] --> B

    B["<b>kernel32.dll</b><br/>Forwarding thunk only<br/>48 FF 25 > kernelbase.dll<br/><i>No real implementation here</i>"]
    B --> C

    C["<b>kernelbase.dll</b><br/>Actual Win32 implementation<br/>Parameter validation, type translation<br/><i>Calls ntdll equivalent</i>"]
    C --> D

    D["<b>ntdll.dll</b><br/>NT API layer<br/>NtAllocateVirtualMemory<br/><i>Last stop in userland - syscall stub</i>"]
    D --> E

    E["<b>syscall instruction</b><br/>CPU transitions to kernel mode<br/>Syscall number identifies the operation"]
    E --> F

    F["<b>Windows Kernel</b><br/>nt!NtAllocateVirtualMemory<br/><i>The actual memory allocation</i>"]

    G["<b>EDR (e.g. CrowdStrike)</b><br/>Patches ntdll bytes at startup<br/>Redirects Nt* calls to its handler"]
    G -. "inline hook" .-> D

    H["<b>MDE / kernel EDR</b><br/>Kernel callbacks + ETW providers<br/>Observes from ring 0"]
    H -. "kernel callback" .-> F

    style G fill:#c0392b,color:#fff
    style H fill:#8e44ad,color:#fff
    style D fill:#e67e22,color:#fff
    style E fill:#27ae60,color:#fff
The layers can be simplified as:
| Layer | Component | Role |
|---|---|---|
| Win32 forwarding | kernel32.dll | Export compatibility layer |
| Win32 implementation | kernelbase.dll | Parameter translation and validation |
| NT API | ntdll.dll | Syscall stubs |
| Kernel | ntoskrnl.exe | Actual implementation |
kernel32.dll Is Mostly a Forwarding Layer
Many developers assume:
1
2
3
VirtualAllocEx
    ↓
kernel32.dll
is the implementation.
In reality, most modern exports in kernel32.dll are forwarding stubs that redirect execution into kernelbase.dll.
For example:
1
48 FF 25 XX XX XX XX
represents:
jmp [rip+offset]
The actual implementation typically lives elsewhere.
This becomes important when discussing hook detection because observing the forwarding layer tells us very little about where execution ultimately goes.
The ntdll Syscall Stub
ntdll.dll represents the last stop in user mode before control transitions into the kernel.
A typical syscall stub looks like this:
NtAllocateVirtualMemory:

4C 8B D1          mov r10, rcx
B8 18 00 00 00    mov eax, 0x18
0F 05             syscall
C3                ret
Only a handful of instructions exist.
The syscall stub:
- Moves parameters into the expected registers
- Loads a syscall number
- Executes
syscall - Returns to the caller
This structure is highly predictable.
A typical clean pattern appears as:
1
4C 8B D1 B8 XX XX 00 00 0F 05 C3
where the syscall number varies by function.
Because these stubs are small and predictable, modifications are often easy to identify.
Why EDRs Hook ntdll
Some EDR platforms intercept execution at the ntdll layer.
Instead of allowing:
1
2
3
4
5
NtAllocateVirtualMemory
    ↓
syscall
    ↓
kernel
they replace the beginning of the function with a jump into their own monitoring routine.
Conceptually:
1
2
3
4
5
6
7
NtAllocateVirtualMemory
    ↓
EDR handler
    ↓
syscall
    ↓
kernel
This allows the EDR to inspect arguments and observe activity before the syscall reaches the operating system.
Techniques such as:
- Direct syscalls
- Syscall stub generation
- ntdll remapping
- ntdll unhooking
exist largely to bypass this style of interception.
The obvious question therefore becomes:
Is MDE actually doing this for the injection APIs?
What MDE Appears To Hook
Running HookDetector on a Windows 11 system with Defender for Endpoint enabled produced a result that challenged one of my assumptions.
Rather than seeing injection-related syscall stubs patched in userland, the relevant ntdll entry points appeared clean.

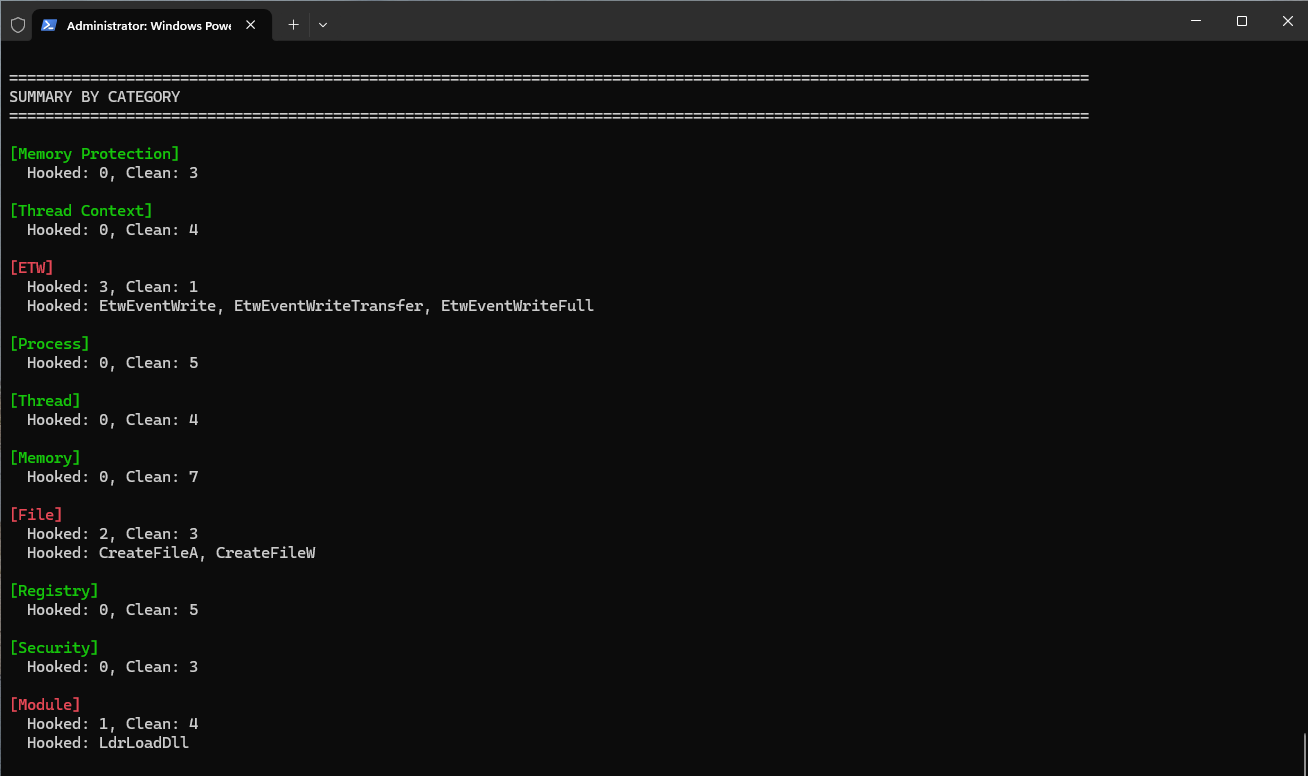
Headline results:
1
2
3
[*] Total Functions Checked: 45
[!] HOOKED Functions: 6
[+] CLEAN Functions: 39
A limitation of the tool is that it cannot always distinguish a complex implementation from a hooked one.
The most reliable results are the syscall stubs because their expected structure is simple and well understood.
The injection-related stubs examined during testing all reported clean:
1
2
3
4
5
[CLEAN] NtAllocateVirtualMemory
[CLEAN] NtWriteVirtualMemory
[CLEAN] NtProtectVirtualMemory
[CLEAN] NtCreateThreadEx
[CLEAN] NtCreateUserProcess
Every injection-relevant syscall stub examined during testing appeared unmodified.
There were no observable inline hooks on the primary injection path.
The Forwarding Thunk Pattern
The output also showed:
1
2
3
4
5
[CLEAN] kernel32!VirtualAllocEx
48 FF 25 ...

[CLEAN] kernel32!WriteProcessMemory
48 FF 25 ...
Some readers may initially interpret these jumps as hooks.
They are not.
These are standard forwarding thunks that redirect execution into kernelbase.dll.
This behaviour is normal and expected.
The presence of a jump instruction in kernel32.dll is not evidence of interception.
What Different EDR Approaches Look Like
The testing environment produced roughly the following picture:
| Function | Tested MDE System | Userland-Hooking EDR (Typical) |
|---|---|---|
NtAllocateVirtualMemory | Clean | Often hooked |
NtWriteVirtualMemory | Clean | Often hooked |
NtCreateThreadEx | Clean | Often hooked |
EtwEventWrite | Hooked | Varies |
LdrLoadDll | Hooked | Often hooked |
CreateFileA/W | Hooked | Varies |
The important observation is not that MDE lacks visibility.
The important observation is that the visibility does not appear to originate from inline interception of the injection-related syscall stubs examined during testing.
Against the tested MDE deployment there was therefore nothing to unhook on the primary syscall path because those stubs already appeared clean.
What This Means for an Injector
Consider the classic injection workflow:
1
2
3
4
5
6
7
OpenProcess
    ↓
VirtualAllocEx
    ↓
WriteProcessMemory
    ↓
CreateRemoteThread
Internally that becomes:
| Win32 API | NT API |
|---|---|
VirtualAllocEx | NtAllocateVirtualMemory |
WriteProcessMemory | NtWriteVirtualMemory |
CreateRemoteThread | NtCreateThreadEx |
The operations remain observable.
The results simply suggest that visibility is being derived somewhere other than userland interception of the syscall stubs examined during testing.
This distinction matters.
An import table tells an analyst what a binary appears designed to do.
Runtime telemetry records what it actually does.
Alert generation is a separate step entirely.
The Practical Proof
Inspecting bytes is interesting.
Executing the workflow is more convincing.
For this test, BasicInjector.exe deliberately avoided shellcode.
Instead it:
- Resolved
WinExecusingGetProcAddress - Allocated
PAGE_READWRITEmemory in a target process - Wrote the string
"calc.exe" - Executed
WinExec("calc.exe")through a remote thread
No shellcode.
No executable memory allocation.
No staged payload.
No network activity.
ThreatCheck result before execution:
1
[+] No threat found!
Runtime output:
1
2
3
4
5
6
7
PS C:\> .\BasicInjector.exe

[*] WinExec @ 0x7FFA92990790
[*] Target PID: 11340
[*] String allocated at 0x1EE738A0000
[*] Wrote 9 bytes
[+] Remote thread created - WinExec("calc.exe") running in notepad
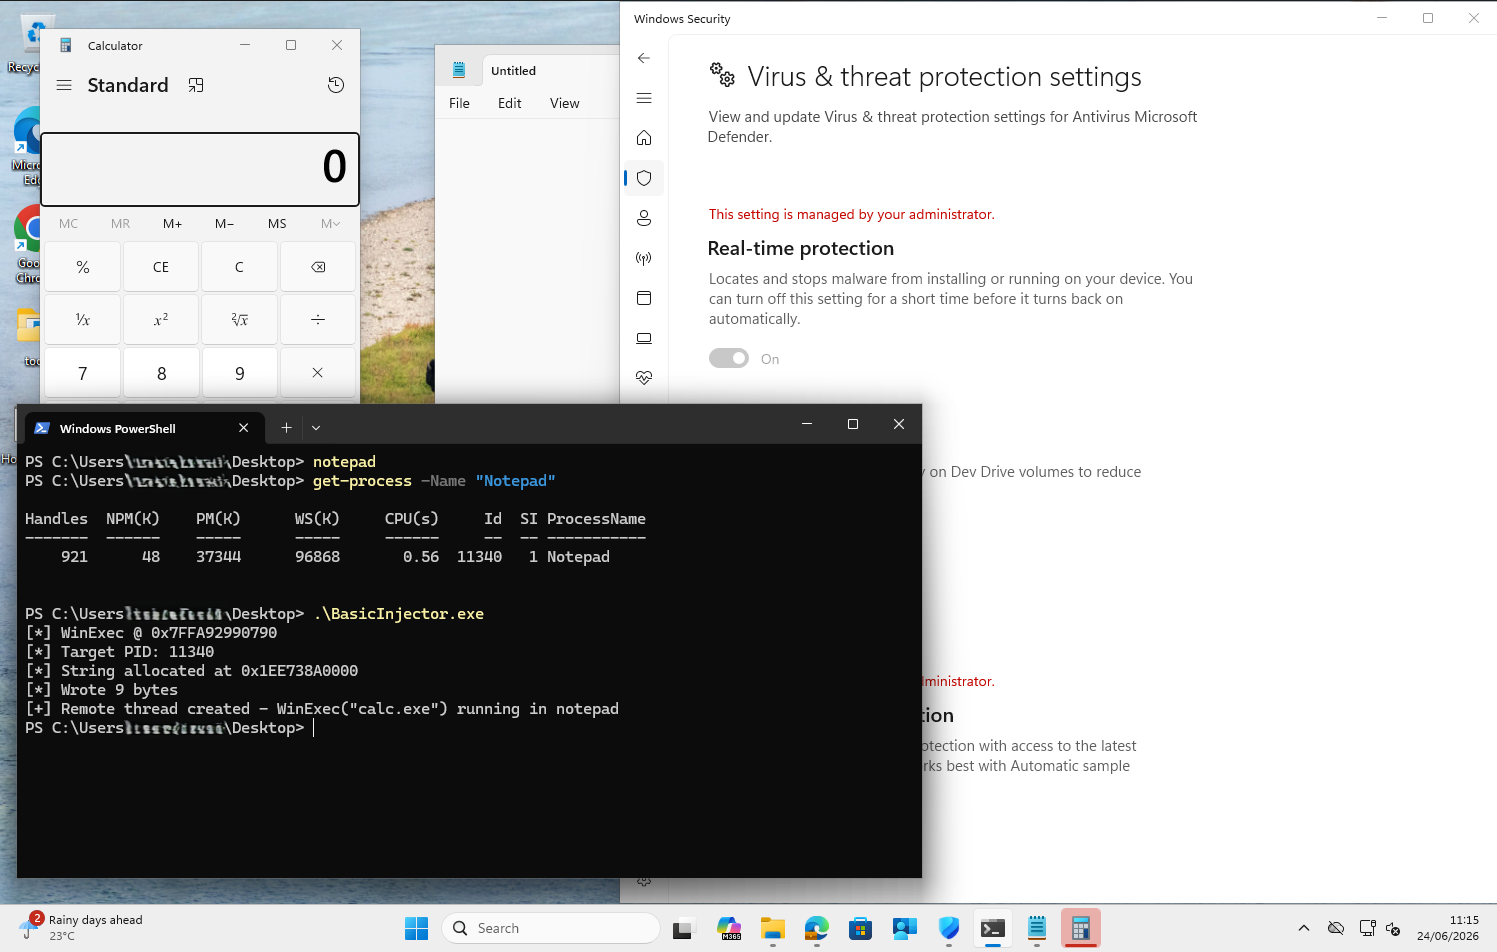
Calculator launched successfully.
No alert was generated.
The complete injection workflow executed successfully:
- Process access
- Remote memory allocation
- Remote memory write
- Remote thread creation
The point is not that these activities were invisible.
The point is that they occurred without producing an alert despite representing the same workflow commonly associated with process injection tooling.
What The Result Actually Means
It would be incorrect to conclude from this test that process injection is undetectable.
It would also be incorrect to conclude that MDE ignores the underlying activity.
The important observation is much simpler:
The API calls alone were insufficient to generate an alert on the tested system.
Telemetry still existed.
Events were still generated.
The injection sequence was still observable.
However, the operation completed without triggering a detection because no overtly malicious behaviour followed.
There was:
- No shellcode execution
- No persistence
- No credential access
- No lateral movement
- No command and control traffic
This supports the idea that telemetry collection and detection are separate concerns.
The APIs generated activity.
That activity alone did not cross the threshold required to produce an alert.
Key Takeaway
The most interesting finding was not that calc.exe launched.
It was that a complete process-injection workflow executed successfully despite a widely held assumption that the underlying APIs are themselves detection triggers.
The experiments in Part 1 and Part 2 suggest a consistent pattern:
- The imports were visible.
- The API calls were visible.
- Neither observation alone was sufficient to generate an alert.
On the tested system, the import table did not appear to be the trigger.
The API calls did not appear to be the trigger by themselves.
The evidence instead points toward a model where telemetry is collected continuously and detections emerge from behavioural context, correlation, and subsequent activity.
In short:
On the tested deployment, visibility, telemetry, and detection appeared to be distinct concerns.
Understanding the difference is far more useful than assuming where a detection occurs.
What Comes Next
Part 3 asks a different question:
If the imports were not the detection trigger, at what stage do we get detected?
- Part 3: Payloads, Memory, and Runtime Reality